Not all electricity is created equal… some electricity is cheaper than the rest and some electricity is cleaner. The price is a function of various things including how many electricity-consuming things across the network want that bit of electricity at that time – it’s basic demand and supply economics. The cleanliness is a function of the mix of generation sources that are generating electricity at the time in the area. Here at tepeo we have been exploring how to make sure we draw the best electricity in terms of cost and carbon footprint for you while at the same time making sure that your ZEB is always as charged up as it needs to be at any time to meet your household heating demand.
We have designed part of the ZEB intelligence that is located remotely to be responsible for calculating charging schedules for all our active ZEBs. It starts with the predicted hot water and heating demand for your home – we use a machine learning algorithm to predict this, having fed it a diet of your home’s historical usage and local weather data. It then looks at the weather forecast for the coming 24 hours and predicts the likely resultant heating requirement. This gives our charging algorithm the target profile of heat output to aim to be able to deliver, with the aim of keeping the charge level as low as possible at any given time.
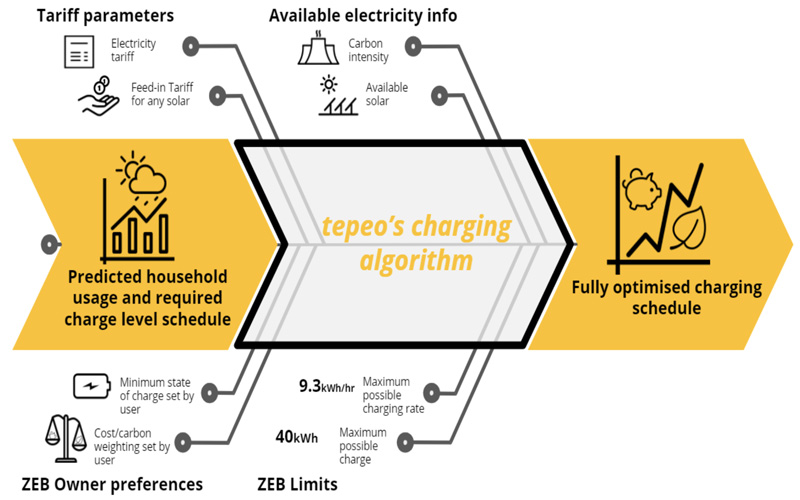
We then overlay the following inputs associated with each ZEB:
- Minimum state of charge, as set by the ZEB owner, in line with their sense of a minimum amount of energy to always have on standby – e.g. this might be 5kWh – enough for a hot bath or two and to warm an extra bedroom for an unexpected guest!
- Cost/carbon weighting, also set by the ZEB owner, according to whether they care more about the cost, or the carbon footprint, or a bit of both.
- The maximum possible charging rate – this is a physical limit on the ZEB itself which is 9.3kW (or 9.3kWh per hour…) for our current model.
- Overall ZEB capacity – 40kWh for the current model.
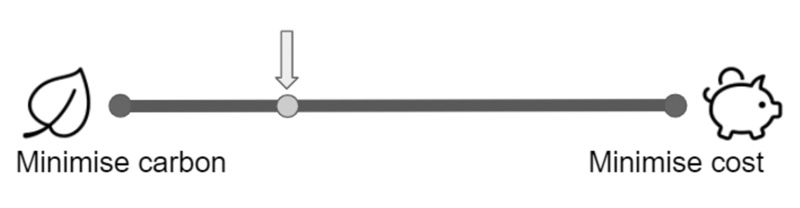
Users choose how cost or carbon conscious they are.
Then we overlay the other inputs for any particular day:
- Electricity tariff – this may be static such as the Octopus Go tariff which is one rate for most of the day and then a cheap rate between 0030-0430, or it may be dynamic such as the Octopus Agile tariff where the half-hourly prices for the following 24 hours are published and picked up by our application programming interface every day.
- Carbon intensity – we currently use carbonintensity.org.uk but there are several ways of deriving this (this is on a half-hourly basis).
- Spare solar production anticipated (this is specific to your house, combining local weather forecasts and historic solar performance from previous days).
- Export tariff
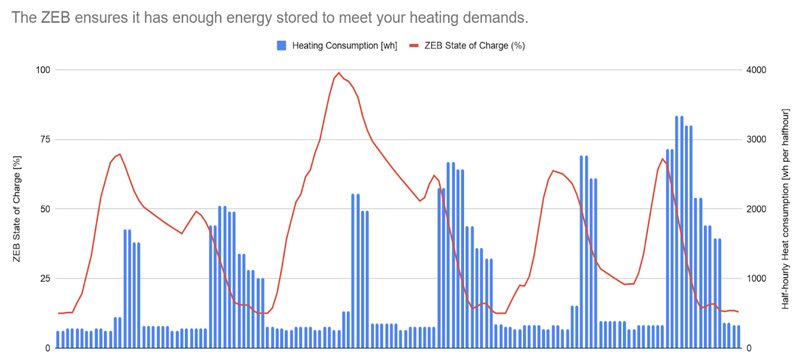
The charging strategy is continuously monitored throughout the ZEB’s operation to ensure that your household’s heating demands are being met. On a typical day, the ZEB might be called upon by National Grid to soak up renewable generation when there is a surplus or to balance the electricity system on faster time scales. If you have solar PV installed on your roof, we will be continually tuning our predictive models in order maximise solar charging. All of this is done while making sure that you have enough hot water to have a shower when you want it, or to do the dishes when you need to do them!
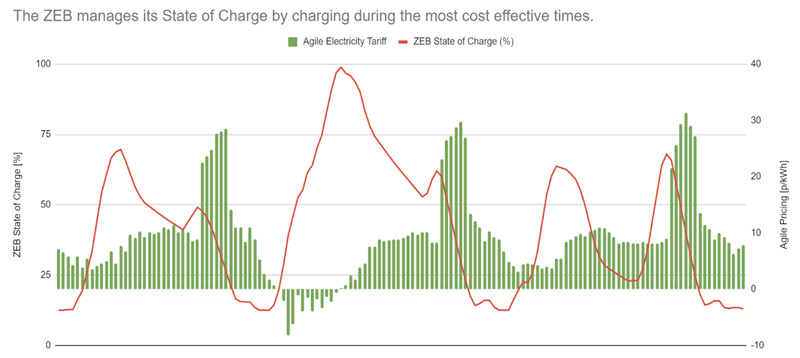
In the plots below (which cover three days starting 00:00:00 24th October 2020 and ending 23:30:00 26th October 2020), we can see how a ZEB would handle negative pricing using the Octopus Agile tariff. During the early hours of 25th of October 2020, the Agile tariff became negative. We can see that the ZEB took advantage of this by charging itself to 100%. Throughout this period of three days, the ZEB also retained a base state of charge to act as a buffer for impromptu requirements for heat when needed. It is worth noting that on the 25th of October, the ZEB would have made money for the homeowner by taking advantage of negative pricing!